Expand Your Horizons
Feature Expansion and Linear Classifiers
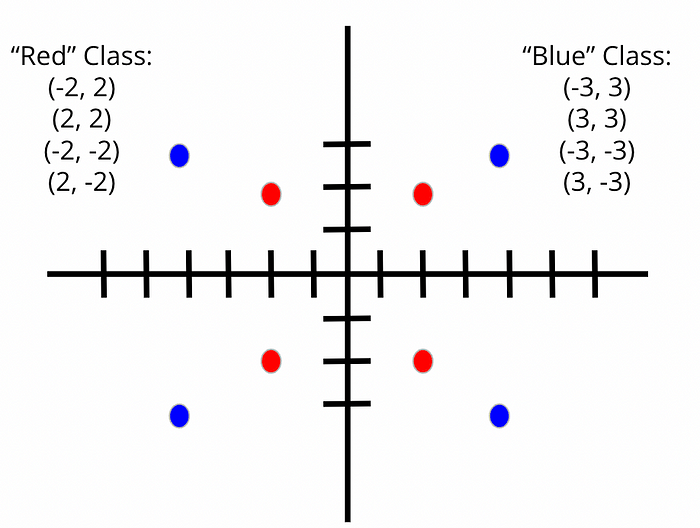
Let’s start with an impossible problem. You are trying to use a linear classifier to classify data into “Red” and “Blue” categories. You have only eight data points, and the data have the following distribution:

Of course, we don’t know the distribution ahead of time, so all we know is no matter how hard we try, we are at *best* going to be 50% accurate making predictions on our training data. In two-dimensional space, it is completely impossible to draw an accurate linear classifier on our training data given this data. We would appear to be doomed to a high-bias model.
As you might suspect, however, this blog post wouldn’t exist if that were the end of the story. And you’re right. Time to introduce feature expansion into our machine learning repertoire.
Making the Impossible Possible
Feature expansion works by taking the features we have in our data and doing something with or to them — and in the process adding additional dimensions — to see if a resulting hyperplane can be drawn with greater accuracy. Let’s say we decided to add a third dimension and, as an experiment, decided to sum the squares of our X and Y feature values to create a third dimension.
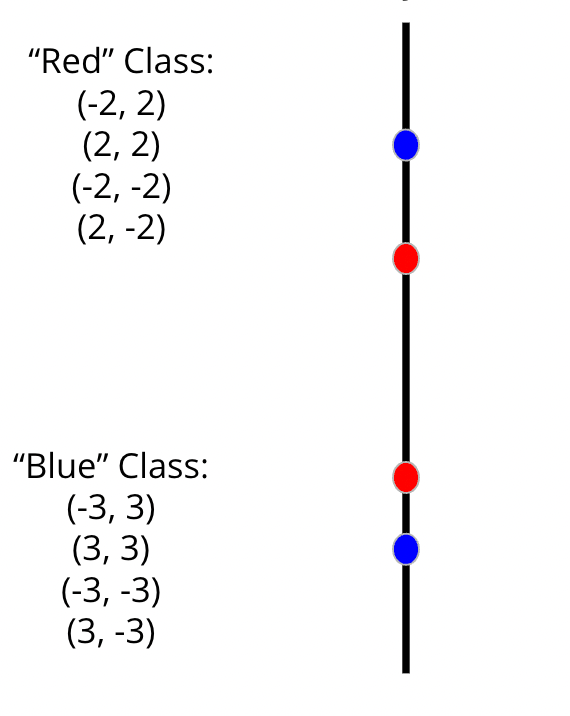
In the images below, I have rotated the 2-dimensional grid by 90 degrees so that we can see the results of our actions. Note that while only four data points are now visible in this rotated view, all eight are still present. They are just on the other side of the 2-dimensional grid and have the exact same Y values, so we can’t see them from this angle.

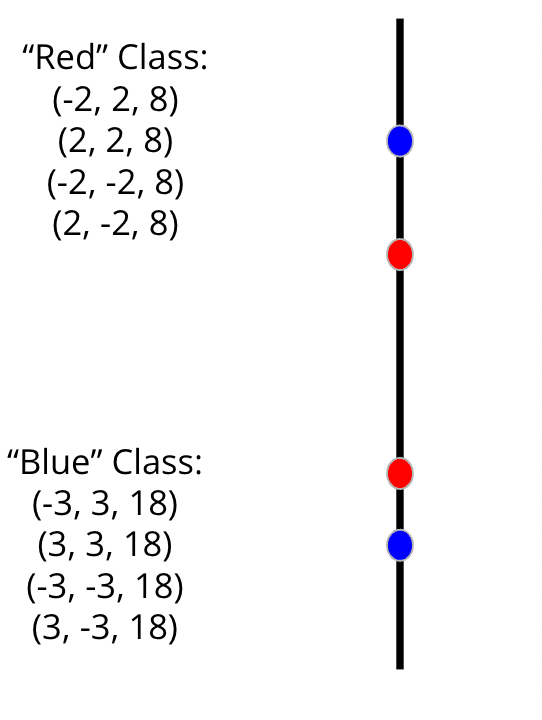
Now that we are oriented correctly, let’s add that sum of squares value to our data as the third dimension:

Now that we’ve created this 3D data, let’s visualize how that shifts the data points in this third dimension:

And now, with this third dimension in place, we once again run our linear classifier. This time, we are able to find a separating hyperplane that gets it right 100% of the time on our training data!

Expanding Features on Expanding Data
There are other ways we could have expanded the features here for our third dimension and come up with a separating hyperplane. We could have squared the X value or Y value, for example, and made that value our third dimension, and in this particular case, that would have worked.
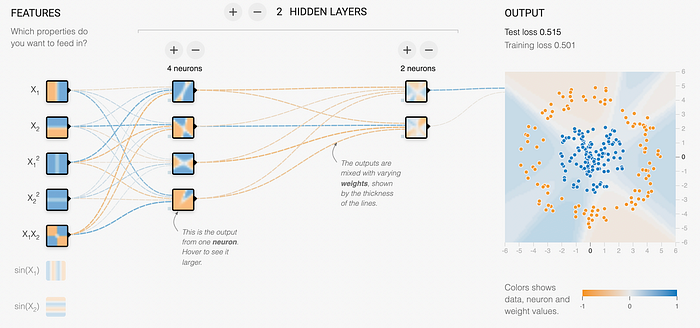
When I realized this, suddenly something that I had seen before and not understood made complete sense. If you take a look at the Tensorflow Playground, one of the things it gives you the ability to do is add “neurons” which are really just expanded features. I had played with this demo several times before, but had never really understood the point of adding the additional neurons. When I figured out the example above, suddenly everything clicked. By adding another dimension, you are potentially able to more quickly find the function that separates the classes, just like in our example above.

To this point, there are other things we could have tried in our example that would *not* have worked — for example, nearly any direct interaction between X and Y (multiplication, division, addition, or subtraction) would have resulted in the same predictive accuracy as our 2D data, simply because of the way the example was constructed. Or, if all of the data points had existed on an origin (2, 0 / 0, 2 / 3, 0 / 0, 3 / etc.), multiplying our features to create the third dimension would have resulted in all 0’s, which would have not been helpful at all.
The trick is, we don’t know ahead of time which expansions are going to work and which ones won’t. It all depends on the data values, and in the real world, you’re probably dealing with a lot more than eight observations of 2D data. So it may take some experimentation to discover if feature expansion will allow you to build a linear classifier on your data, and if so, what types of expansion will do the trick.
Challenges and Limitations
This gets tougher as you deal with higher-dimensional data. Imagine you’re wanting to try multiplying feature values by one another to try to come up with a separating hyperplane. Since you don’t know which feature combinations are going to work best, you really need to try them all! If you have 10 features, this results in 2 to the 10th power possible combinations, or more than 1,000 combinations to try to find the best one. Add one more feature, and now you’re exceeding 2,000 combinations, and every additional feature doubles the workload.This exponential growth would be problematic if it weren’t for a thing called the Kernel Trick, which I will probably write about in a future post.
It’s also important to note that this approach doesn’t do anything to mitigate noise — and in particular, mis-labeled data. If you’re trying to build a linear classifier on noisy data, you’re going to have to account for noise, potentially by using a Support Vector Machine (again, a probable topic for future writing.)
For now, it’s enough to understand that feature expansion allows us to use linear classifiers on some data that are not typically considered linearly classifiable by creating new features in a new dimension.